
tldr: Boards don't buy test coverage. They buy fewer incidents and faster releases at a known price. The model below gets you there in four steps, with every number's arithmetic shown.

The question behind the question
When a board or CFO asks about the ROI of test automation, they are asking three things underneath. What does doing nothing cost us? What does your proposal cost? And when does it pay for itself?
Most QA pitches answer none of these. They lead with coverage percentages and test counts, which are engineering metrics, and test count in particular is a metric that rewards waste. The pitch that works prices the status quo first. Everything below uses one worked example, a 12-engineer team at a fully loaded $75 an hour, so you can swap in your own numbers line by line.
Step 1: price the current state
Doing nothing has a run rate. It hides in three line items.
Manual regression time. Say two engineers spend six hours each checking critical flows before your weekly release. That's 12 hours a week, 624 hours a year, which at $75 an hour is $46,800 a year of engineering time spent clicking through the app.
Escaped incidents. Count last year's actual production regressions, not a projection. Our example team ships one a month: 12 incidents, each costing about $2,500 (roughly 20 engineering hours of triage, fix, and hotfix deploy, about $1,500, plus a conservative allowance for customer-facing damage). That's $30,000 a year.
The flake tax, if you already have a suite. Rerun-and-shrug time compounds shockingly fast; we published the formula and the math separately. Our example team has no suite yet, so we'll leave this at zero.
Current state: $76,800 a year, and it scales up with headcount and release frequency. That's the number the rest of the model beats or doesn't.
Step 2: price every option, including the one you want
| Option | Annual cost | What's in the number |
|---|---|---|
| DIY: tool + own maintenance | $54,000 | $10K tool license, $5K test infrastructure, a quarter of a senior engineer's year ($39,000 at $75/hr) to write and maintain the suite |
| In-house QA hire | $150,000 | ~$140K fully loaded mid-level hire (the full breakdown) plus ~$10K tools and infra |
| Managed QA | $30,000 | Bug0 Managed at $2,500/month flat: engineer, engine, infrastructure, unlimited runs |
One fairness note your board will appreciate you making unprompted: an in-house hire does more than automate regression. They bring exploratory testing, process ownership, and institutional knowledge. The comparison here is narrowly about automated coverage, and we've published a fuller three-way comparison if the board wants it.
Step 3: estimate the value with haircuts you can defend
Never claim automation eliminates a cost line. Claim a fraction and defend the fraction.
-
Automated coverage replaces 80% of the manual regression pass. Engineers still spot-check new features. Value: 0.8 × $46,800 = $37,440.
-
It catches 8 of the 12 escaped incidents. Not all incidents are regressions in covered flows. Value: 8 × $2,500 = $20,000.
Total defensible value: $57,440 a year. The board will haircut whatever you bring, so bring numbers you've already haircut and say so out loud.
Step 4: ROI and payback
ROI is value minus cost, over cost. Payback is cost over value, in months.
| Option | Annual cost | Annual value | ROI | Payback |
|---|---|---|---|---|
| DIY tool + maintenance | $54,000 | $57,440 | +6% | ~11 months |
| In-house hire | $150,000 | $57,440 | −62% | Beyond year one |
| Managed QA | $30,000 | $57,440 | +91% | ~6 months |
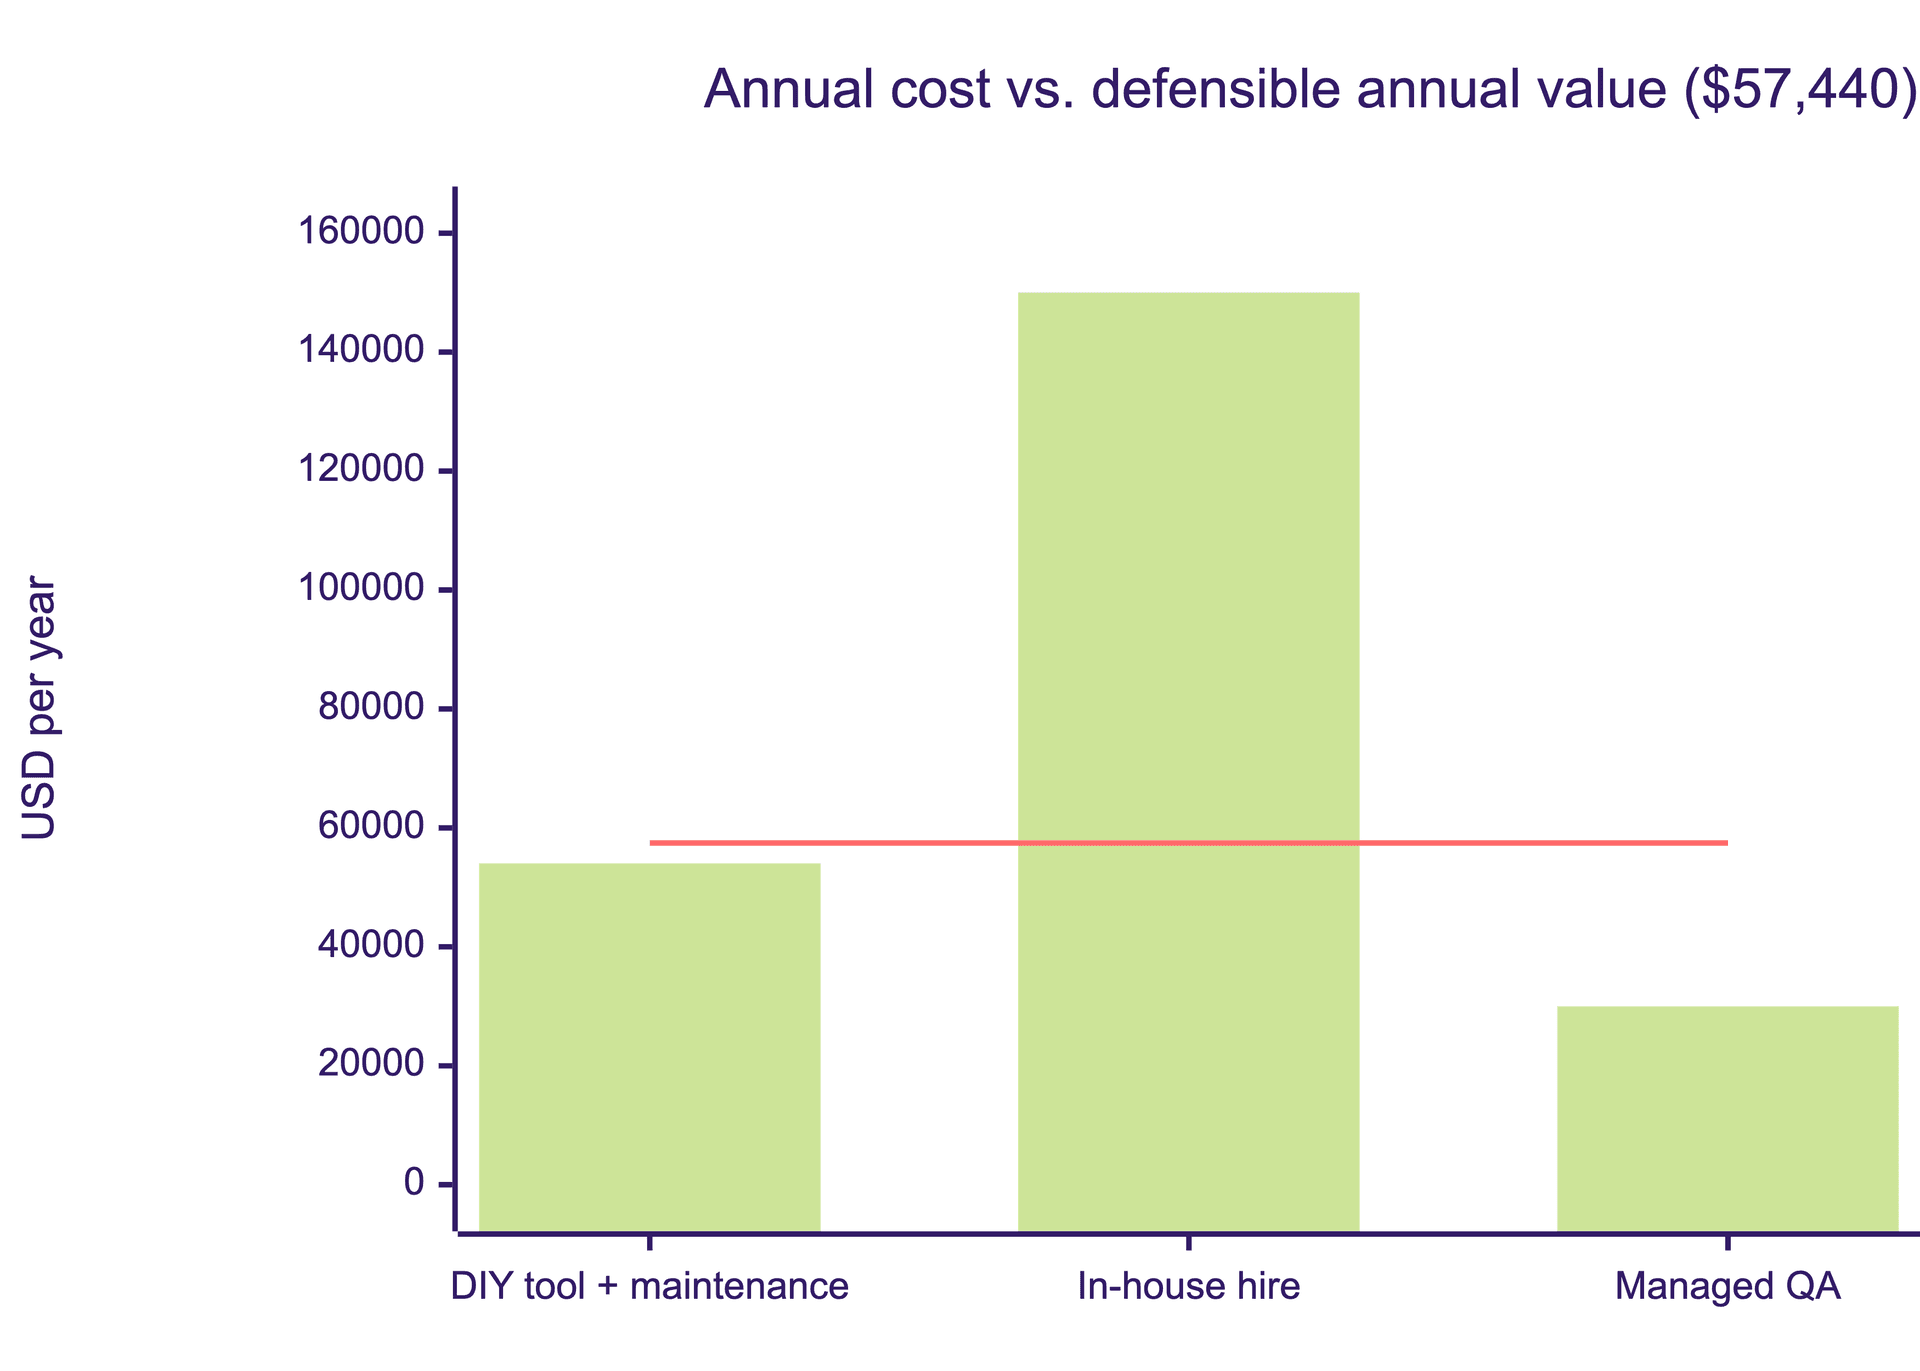
Two things to say when you present this. First, the DIY row's thin margin is fragile: it assumes your engineer's quarter-time estimate holds, and maintenance on selector-based suites has a habit of growing. Second, the hire's negative ROI is a statement about team size, not about QA engineers. At 40 engineers with compliance requirements, that row changes sign.
And run the sensitivity check before the board does: cut the value estimate in half, to $28,720, and managed QA still roughly breaks even in year one while the other rows go deeply negative. An investment that survives a 50% haircut on its own assumptions is an easy yes.
What to report each quarter after the yes
The approval is step one; renewals are won with the right metrics. Report these four, and resist the fifth.
-
Regressions caught before production. The headline number. Attach the would-have-been incident cost.
-
Critical-flow coverage. Percentage of revenue-touching flows under test, not total test count.
-
Time from feature merge to coverage. The metric that shows QA keeping pace with delivery instead of trailing it.
-
Production incident trend. The board-visible outcome, quarter over quarter.
The one to resist is total test count. It only ever goes up, it correlates with maintenance cost rather than protection, and we've written about where that treadmill ends.
The one-slide version
If you get five minutes on the agenda, the slide is three numbers:
-
Doing nothing costs ~$77K a year (manual regression + escaped incidents, shown with your own inputs).
-
The proposal costs $30K a year, flat, everything included.
-
Payback in about six months, positive even at half the estimated value.
Cost of inaction, cost of action, time to payback. That's the entire genre of board decision, and test automation clears it with room to spare when the numbers are built to survive questioning.
FAQs
How do you calculate the ROI of test automation?
Price the current state (manual regression hours, escaped incident costs, flake time), price the automation option (tool, people, infrastructure), then estimate avoided costs with conservative fractions rather than claims of elimination. ROI is value minus cost over cost; payback is cost over value in months.
What does test automation cost in 2026?
Three realistic shapes: a DIY tool plus your own maintenance labor runs around $54K a year for a mid-size team once engineering time is counted, an in-house QA hire is $150K+ fully loaded with tooling, and managed QA services like Bug0 Managed run $30K a year flat with the engineer and infrastructure included.
What QA metrics should be reported to a board?
Regressions caught before production, critical-flow coverage, time from feature merge to test coverage, and the production incident trend. Total test count is the metric to avoid: it grows independently of protection and mostly tracks maintenance burden.
How fast does managed QA pay back?
Using conservative haircuts (80% of the manual regression pass replaced, two-thirds of escaped incidents caught), a 12-engineer team sees payback in about six months at Bug0 Managed's $2,500 monthly flat fee, and the case stays near break-even in year one even if the value estimate is halved.