The AI hype cycle promised leaner teams and faster shipping. By now, most engineering leaders have discovered the uncomfortable truth: AI-assisted development created its own hidden overhead (hallucination cleanup, token costs, and brittle auto-generated code that breaks in production).
Most startup founders think they understand their QA costs. They budget for a QA engineer's salary ($115K-145K, and yes, QA talent that can handle Playwright and AI tools commands real money now), maybe some testing tools ($2-5K annually), and call it a day. However, in this post-AI-hype reality, founders overlook significant hidden costs that can make their actual QA expenses 2-3x higher than budgeted.
Based on industry research and our experience working with fast-growing startups, manual QA typically creates $55K-78K in hidden costs per developer annually when you account for all the indirect expenses. That's not just the QA team – that's the total drain on your engineering organization.
If you're a 10-engineer startup, these hidden QA costs (including the new "automation tax") could be adding $750K-1M per year to your expenses in ways you've never measured.
The 1:6 Budget Delusion
Here's what shows up on your P&L, the comfortable fiction most startups tell themselves:
-
QA Engineer Salary: $115K-145K annually (QA engineers who can actually work with Playwright, Cypress, and AI tooling aren't cheap anymore)
-
Testing Tools: Selenium, Cypress, BrowserStack subscriptions ($2K-5K/year)
-
Infrastructure: Staging environments, testing databases ($3K-8K/year)
-
Recruiting & Onboarding: $3K-5K per QA hire
For a startup with one dedicated QA engineer, that's roughly $125K-165K annually. That's the number in your budget. The actual number is 6x higher.
Where the Other $750K Goes
1. The developer time drain ($55K+ per developer annually)

Your engineers aren't just writing code – they're constantly pulled into QA-related work. Here's what this actually costs:
The 2026 Developer Experience: Picture this. Your senior engineer just finished a feature they've been working on for two weeks. The code is clean, reviewed, and ready to ship. They open Slack to find 47 unread messages in #ci-alerts. The test suite is red. Again.
They click into the failed run. It's not their code; it's a flaky end-to-end test that times out 20% of the time on a completely unrelated flow. But they can't merge until it's green. So they re-run the pipeline. Wait 18 minutes. Still red, different test this time. Re-run again. Now they're stuck in PR Gridlock, burning an hour before they can even context-switch back to their next task.
This is CI/CD Anxiety: the constant, low-grade stress of knowing that any merge attempt might spiral into a two-hour debugging session for tests you didn't write and code you didn't touch.
Bug Investigation & Fixes: When testing does find a real bug, your developer needs to:
-
Abandon their current mental model (in AI-integrated codebases, context recovery isn't measured in minutes; it's measured in whether you can reconstruct your mental state at all)
-
Reproduce the issue (average: 45 minutes)
-
Fix the bug (1-3 hours depending on complexity)
-
Verify the fix (30 minutes)
-
Update any related tests, and pray they don't break something else (30-60 minutes)
The $75/hour drain: A developer earning $150K annually encounters 3-4 bugs per week, plus 2-3 "false alarm" CI failures that still demand investigation. Each cycle takes approximately 3.5 hours. That's 10.5-14 hours weekly lost to QA-related interruptions.
At $75/hour, this costs your company $40,950-54,600 per developer annually just in bug investigation overhead.
Test Case Maintenance: Manual test cases become outdated as your product evolves. Your team spends 4-6 hours weekly updating test documentation, creating new test scenarios, and maintaining testing environments. That's another $15,600-23,400 per developer per year.
2. Time-to-market decay (The cost you can't calculate)
This one doesn't fit neatly into a spreadsheet, which is why most founders ignore it until it's too late.
The 2026 Reality: If your competitor ships an LLM-integrated feature two weeks before you because your regression cycle was stuck in manual review, you don't lose $3K in delayed revenue; you lose the market window. The first credible product with the feature gets the press coverage, the Product Hunt launch, the viral demo on X, the trending GitHub repo. You get to be "the other one that also does that."
Extended Release Cycles: Manual testing adds 2-5 days to each release. For a startup shipping bi-weekly, that's 26-65 extra days per year where features sit in testing instead of reaching customers. In a market where AI capabilities are table stakes by Q3, two months of cumulative delay is a death sentence.
The Compounding Effect: Every feature you're late on shifts customer perception. You're not "the innovative option"; you're "the one that's always catching up." That positioning gap doesn't show up on your P&L, but it shows up in your win rate against competitors, your ability to command premium pricing, and your Series B valuation.
Customer Churn from Quality Issues: Manual testing catches 70-80% of critical bugs. The ones that slip through trigger churn. Losing 1-2 customers monthly to quality issues costs $10K-25K annually in direct churn, but the real damage is the Slack messages in founder communities: "We tried [Your Product], it was buggy, switched to [Competitor]."

3. The scaling challenge ($25K-40K in hiring & training)
As your team grows, manual QA costs compound:
QA Hiring Bottleneck: Skilled QA engineers are scarce. Average time-to-hire: 3-6 months. During this period, your existing team either becomes overworked (leading to burnout and turnover) or developers handle their own testing (reducing feature development by 20-30%).
Training Overhead: New QA engineers need 2-3 months to become productive. During this ramp-up period:
-
Senior QA spends 25% of their time mentoring (cost: $15K-20K in reduced productivity)
-
Bug detection rates drop by 40-60% as new team members learn your product
-
Development velocity decreases as engineers help with training
4. Technical debt & infrastructure creep ($12K-20K annually)
Manual processes create ongoing technical debt:
Flaky Test Management: 30-40% of manual test cases become unreliable over time. Your team wastes hours re-running tests, investigating false positives, and updating procedures.
Environment Management: Costs for multiple staging environments, test data management, and browser/device coverage requirements grow 15-25% annually as your product becomes more complex.
Documentation Overhead: Keeping manual test procedures current requires 8-12 hours weekly across the team at most startups.
5. Why your "free" Playwright suite costs $100K/year
Nobody told you this when you adopted AI-assisted development: the "manual QA" bottleneck didn't disappear; it shape-shifted.
In 2026, your developers aren't clicking buttons anymore. They're acting as full-time babysitters for brittle Playwright scripts that AI generated in seconds but break every time your UI changes. Welcome to Test Suite Janitorial Work.
The AI Testing Paradox: Copilot and similar tools can generate a 200-line end-to-end test in 30 seconds. Sounds great, until that test fails on the next deploy because it hard-coded a selector that no longer exists, assumed a load time that varies by 50ms, or hallucinated an API response format.
The Real Cost: Your senior engineers (the ones you're paying $150K+) now spend 10-15 hours weekly:
-
Debugging why CI is red (again)
-
Updating selectors across dozens of auto-generated tests
-
Rewriting tests that "worked locally" but fail in staging
-
Investigating flaky tests that pass 80% of the time
The Seniority Drain: Here's the part that really stings: this work can't be delegated. AI-generated tests are often too opaque for junior engineers to debug. The test uses patterns the junior didn't write, references selectors they don't recognize, and fails in ways that require deep knowledge of both the codebase and Playwright internals. So it escalates to your lead architects. You're paying Staff Engineer rates for maintenance work that used to be handled by a $60K/year manual QA tester, effectively tripling your cost-per-test-case.
At $75/hour, that's $39,000-58,500 per affected engineer annually. For a team where 2-3 senior devs handle test maintenance, you're looking at $75K-120K in hidden "automation tax."
The Irony: You automated to reduce QA costs. Instead, you traded QA engineer salaries for senior developer salaries, and because juniors can't touch the AI-generated code, the work concentrates at the top of your pay scale. This cost inversion hits even harder when teams buy browser agent tools expecting automation savings.
6. The LLM Testing Gap (The problem nobody's solved yet)
Here's the 2026-specific wrinkle that makes everything harder: you're not just testing deterministic CRUD apps anymore. Your product probably has LLM-integrated features: AI summaries, smart search, generated content, chat interfaces. And traditional testing fundamentally breaks when the "correct" answer isn't a boolean.
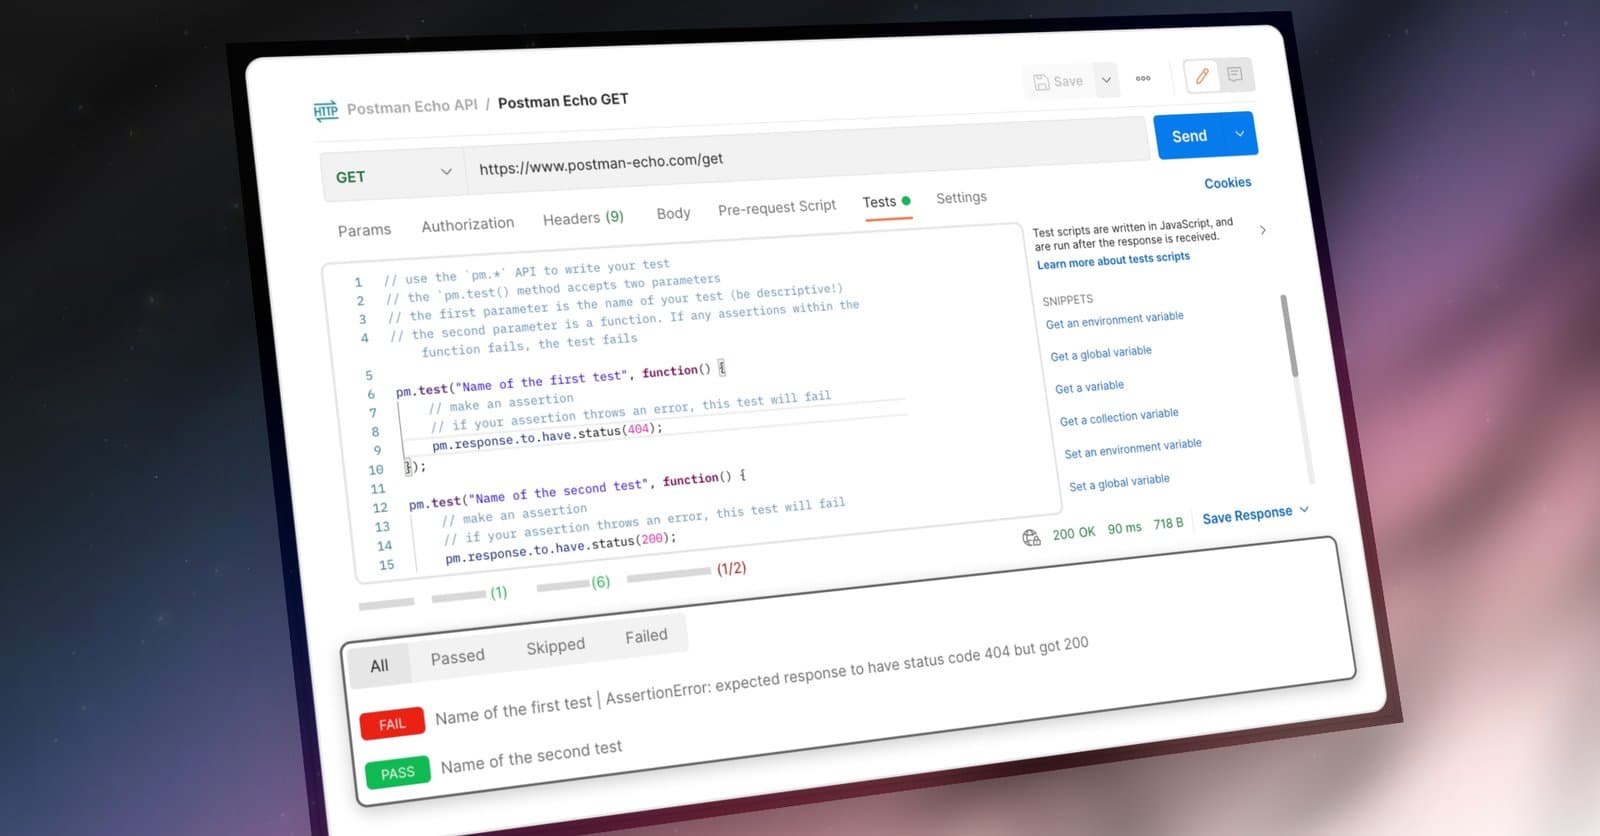
The Non-Determinism Problem: When your AI feature generates a summary, how do you write an assertion? expect(summary).toBe("The meeting covered Q3 projections...") fails immediately; the LLM will phrase it differently every time. So your options are:
-
Skip testing AI features entirely (most teams do this, and regret it when the model hallucinates in production)
-
Write fuzzy matchers that pass 90% of garbage ("contains at least 3 words")
-
Have humans review every output manually (doesn't scale)
-
Build custom evaluation pipelines (takes months, requires ML expertise you don't have)
The RAG Testing Nightmare: If you're using retrieval-augmented generation, you now have two failure modes: the retrieval can return wrong context, and the generation can hallucinate even with correct context. Traditional E2E tests catch neither. Your test says "page loads successfully" while your AI confidently tells users that your product supports features it doesn't have.
The Prompt Regression Problem: You updated a system prompt to reduce hallucinations. Great, except now the tone is different, the formatting changed, and three downstream features that parsed the output are broken. There's no "prompt diff" in your test suite. You find out when users complain.
What this actually requires: Testing LLM features demands a different approach: semantic similarity scoring, LLM-as-judge evaluations, statistical pass rates instead of binary assertions, and humans in the loop for edge cases. Most teams bolt this onto their existing Playwright setup and wonder why coverage is meaningless.

True cost breakdown: 10-engineer startup example
| Cost Category | Annual Cost Range |
|---|---|
| Obvious Costs | |
| QA Engineer Salary + Benefits | $125K - $165K |
| Testing Tools & Infrastructure | $5K - $13K |
| Hidden Costs | |
| Developer Time Drain (10 devs × $65K avg) | $650K |
| Time-to-Market Decay | See below |
| Hiring & Training Overhead | $25K - $40K |
| Technical Debt & Infrastructure | $12K - $20K |
| Test Suite Janitorial Work (2-3 senior devs) | $75K - $120K |
| Total Quantifiable Costs | $892K - $1.01M |
| + Market Position Loss | Incalculable |
Time-to-Market Decay doesn't have a dollar figure because the cost isn't linear; it's existential. Losing the market window on a key feature can mean the difference between category leader and also-ran.
Most startups budget for $140K-180K but actually spend $900K-1M in quantifiable costs alone, before accounting for competitive positioning. A modern managed testing service like Bug0 helps reduce these hidden costs by automating QA coverage and cutting developer overhead.
If you’re deciding between hiring vs. services, our QA engineer salary and alternatives guide compares costs globally and includes a calculator.
What This Actually Looks Like Inside Companies
"We almost lost our Series B over this"
The Setup: 45-person engineering team, $10M ARR, shipping bi-weekly releases. Three dedicated QA engineers. On paper, they had it figured out.
The Internal Crisis: The VP of Engineering was getting pulled into board meetings to explain why velocity had dropped 40% year-over-year. The culprit? They'd adopted Copilot for test generation six months earlier, assuming it would "free up the QA team." Instead, their senior engineers were now spending 30% of their time debugging auto-generated tests that broke on every deploy. The QA team wasn't freed up; they were drowning in triage.
The CEO's exact words in an all-hands: "We're shipping half as many features as last year, and I still don't understand why."
What the audit revealed:
-
Developer time drain: $540K annually (30% of engineering payroll going to QA work)
-
Release delays: $25K in delayed feature revenue per cycle
-
Customer churn from bugs that slipped through: $180K in lost ARR
-
One enterprise deal lost because a demo crashed: $200K (not in the spreadsheet, but everyone remembered it)
After switching to managed automation:
-
Developer QA overhead dropped from 30% to 8%
-
Release cycle shortened by 2.5 days
-
Critical production bugs down 85%
-
The VP kept his job. The Series B closed.
"Our best engineer quit over flaky tests"
The Setup: 12-person fintech startup, mobile payment app, 50K+ users. Moving fast, breaking things, until the things they broke started costing real money.
The Breaking Point: Their lead iOS engineer, the one who'd been there since day one, gave notice. Exit interview reason? "I didn't join a startup to spend 15 hours a week babysitting a test suite I didn't write." He wasn't wrong. The team was running 2 full days of manual regression per release, and production incidents were hitting 3-4 per month. The on-call rotation was brutal.
The founder later admitted: "We thought we were saving money by not investing in QA infrastructure. We were actually bleeding our best people."
The damage:
-
Manual regression: 2 full days per release (while competitors shipped daily)
-
Developer context switching: 15 hours/week average across the team
-
Production incidents: 3-4/month requiring weekend hotfixes
-
One regulator inquiry after a payment bug: legal fees not disclosed
After getting serious about automation:
-
Regression testing: 4 hours automated + 2 hours manual review
-
Developer QA overhead cut by 70%
-
Production incidents: <1 per month
-
Expanded into two new markets, ahead of their competitor who was still stuck in "regression hell"
Journyx: "We tried to DIY it. Twice."
The Setup: Established time-tracking software company. Not a startup; they'd been around long enough to have tried (and failed) at test automation before.
The Honest Version: Their first automation attempt produced a test suite that covered 30% of critical flows and required constant maintenance. Their second attempt used an AI tool that generated tests faster but broke just as often. The engineering team had "automation fatigue"; they'd been burned twice and were skeptical of any solution that promised to fix the problem.
The engineering lead's concern: "We've already wasted two years and significant budget on automation that didn't stick. Why would this be different?"
What changed: The difference was ownership. Previous attempts left maintenance on their plate. This time, the automation came with humans who maintained it, and Journyx's engineers never had to touch a flaky selector again.
The outcome: $5,000-$10,000/month in savings vs. equivalent US-based resources. But the real win? The engineering team actually trusted the test suite for the first time in years. Deploys stopped being anxiety events.
The Third Option: Managed Automation Built for the 2026 Stack
The binary choice ("manual QA" vs. "DIY automation") is a false one. Both leave you paying senior engineers to do work that isn't shipping features. And neither handles the LLM testing problem.
Bug0's managed testing service is the third option: automation that comes with humans who maintain it, built for the complexity of modern AI-integrated products. That means:
-
Deterministic flows get traditional E2E coverage, but maintained by us, not your senior engineers
-
LLM-integrated features get semantic evaluation, not brittle string matching
-
Prompt regressions get caught before they reach production, with human review for edge cases
-
RAG pipelines get tested at both the retrieval and generation layers
You get the coverage without the janitorial work, and without pretending that expect(aiResponse).toContain("hello") is meaningful test coverage.
For a deeper look at where AI-native testing is actually useful, see our breakdown of Playwright Test Agents, the new AI helpers that plan, generate, and heal tests automatically (when managed correctly).
Investment vs. returns
Annual Investment: $8K-25K for comprehensive automated testing (depending on complexity)
Savings Achieved:
-
Developer Time Savings: 60-70% reduction in QA-related context switching
-
Release Velocity: 2-3x faster shipping cadence
-
Quality Improvement: 90-95% bug detection vs 70-80% with manual testing
-
Scaling Efficiency: No linear increase in QA costs as team grows
ROI timeline for 10-engineer team
| Month | Investment | Savings | Net Impact |
|---|---|---|---|
| 1-3 | $15K setup | $25K | +$10K |
| 4-6 | $5K ongoing | $60K | +$55K |
| 7-12 | $10K ongoing | $120K | +$110K |
| Year 1 Total | $30K | $205K | +$175K |
ROI hits positive in month 2. By month 6, you've paid for the year.
The Exceptions (Yes, They Exist)
Managed automation isn't universal. Skip it if:
-
Very early-stage startups (pre-product-market fit) with simple, rapidly changing products
-
Highly regulated industries with specific compliance requirements that require human judgment
-
Teams with existing, well-functioning QA processes that aren't experiencing the bottlenecks described above
Past product-market fit and shipping to real users? The economics have already decided for you.
Five Signs You're Already Bleeding (2026 Edition)
The old warning signs ("releases are slow," "bugs reach production") are table stakes. Here's how you know your QA situation has crossed into crisis territory:
1. The Mute Button
Your team has muted #ci-alerts. Or worse, they see the red builds and assume it's "probably just a flaky test" without checking. When your CI pipeline cries wolf 10 times a day, nobody investigates the 11th alert. That's when real bugs ship.
2. Shadow QA
Your developers are quietly hiring Upwork contractors to manually test their features before submitting PRs, on their own dime or expensing it as "consulting." They've given up on the official process being fast enough to unblock them.
3. The "Just Ship It" Culture
Engineers have started merging with failing tests and adding // TODO: fix flaky test comments. Your test suite has become a suggestion, not a gate. You find out about bugs from customers, not CI.
4. The Senior Engineer Tax
Your highest-paid ICs (the ones you hired to architect systems and mentor juniors) are spending their 1:1s debugging why Playwright can't find a button that definitely exists. They're too expensive for this work, and they know it.
5. The Velocity Lie
Your sprint velocity looks fine on paper, but half the "completed" tickets are reopened within two weeks due to bugs found post-deploy. You're not shipping features; you're shipping bugs and then shipping fixes.
The 90-Day Fix
Days 1-30: Assessment & planning
-
Audit current QA costs using all categories above
-
Map critical user flows that must be tested
-
Evaluate automation solutions and get stakeholder buy-in
-
Set success metrics and timeline expectations
Days 31-60: Implementation & migration
-
Set up automated testing infrastructure
-
Begin migrating highest-priority test cases
-
Train team on new processes and tools
-
Maintain manual testing for uncovered areas
Days 61-90: Optimization & scale
-
Achieve 70-80% automated coverage of critical flows
-
Measure time savings and quality improvements
-
Plan for scaling automated testing across all features
-
Begin reducing manual QA overhead
Run Your Own Numbers
Developer time calculation:
-
Number of developers: ___
-
Average developer salary: $___
-
Hours per week spent on QA tasks: ___
-
Annual cost: (Salary ÷ 2080) × Hours/week × 52 × Number of developers
Release velocity calculation:
-
Release frequency: ___ per month
-
Days of delay per release due to QA: ___
-
Revenue per feature per month: $___
-
Annual opportunity cost: Release frequency × 12 × Days delay × (Revenue ÷ 30)
Add these to your obvious costs for your true QA spend.
The bottom line
Manual QA isn't just expensive – and in 2026, neither is unmanaged automation. Both are compound drags on your entire engineering organization. While you're budgeting $140K-180K for QA, you're actually spending $900K-1M annually when you account for all the hidden costs, including the "automation tax" your senior engineers are silently paying.
The startups that recognize this reality early and switch to intelligent automation gain a significant competitive advantage. They ship faster, with higher quality, at a fraction of the cost.
The question isn't whether you can afford to automate your QA – it's whether you can afford not to.
For the strategy-level view of why the canonical testing frameworks broke in 2026, read software testing strategies are obsolete in 2026.
Ready to automate your QA?
Bug0's AI-native QA automation delivers 100% critical flow coverage in 7 days, with zero maintenance overhead. Try Bug0 Studio (self-serve, from $250/month) or Bug0 Managed (done-for-you QA, from $2,500/month).
Sign up free for Bug0 Studio or join our 90-day pilot program and keep the test suites we create, even if you don't continue.
Sources & Methodology
A note on data: Most QA cost research predates the AI-assisted development era. Legacy studies measured context-switching in pre-Copilot environments with deterministic test suites. The figures in this article use 2024-2025 baseline data adjusted for the increased complexity of modern AI-integrated stacks, where context recovery is harder, test maintenance is more frequent, and the failure modes are less predictable. Where we cite older research, it's to establish floor estimates that have only increased.
Salary & compensation (2025)
-
PayScale (2025). "Quality Assurance (QA) Engineer Salary in 2025."
-
Built In (2025). "2025 QA Engineer Salary in US."
Developer productivity & context switching (2025)
-
Tech World with Milan (2025). "Context-switching is the main productivity killer for developers."
-
Asana (2025). "Context Switching is Killing Your Productivity [2025]." Anatomy of Work Index.
Flaky tests & test maintenance (2024-2025)
-
BrowserStack (2025). "What is a Flaky Test: Causes, Detect & Fix."
-
TestRail (2024). "How to Identify, Fix, and Prevent Flaky Tests."
QA hiring & talent market (2024-2025)
-
Rainforest QA (2025). "Think twice before you hire a QA engineer."
-
YouTeam (2024). "Everything You Need to Know Before Hiring a QA Engineer in 2024."